AI-powered biodiversity mapping for a nature-positive future
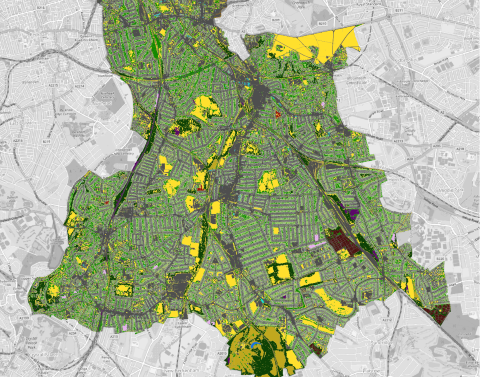
Gentian’s advanced AI technology analyses high-resolution satellite imagery to deliver unparalleled biodiversity insights. Our tools go beyond simple vegetation mapping, enabling organisations to classify habitats, monitor invasive species, quantify biodiversity, and more.
.png?width=1375&height=846&name=natwest%20(2).png)
What we do
Gentian’s advanced AI technology analyzes high-resolution satellite images and maps biodiversity across habitats worldwide. Our tools transform complex ecological data into clear, intelligent insights—mapping vegetation, canopy cover, tree counts, green roofs, and other biodiversity changes over time with unmatched precision and speed.

Precision data
Gentian sets the gold standard in biodiversity mapping, using high-resolution satellite imagery and AI to deliver unmatched accuracy. Our data reveals often overlooked ecological details, empowering you to make confident, informed decisions.

Unmatched speed & ease
Get the insights you need—fast. Gentian’s AI-powered platform delivers biodiversity assessments in days, sometimes hours or even minutes, streamlining compliance, risk management, and conservation planning with effortless integration.

Visionary expertise
Led by ecologists, AI specialists, and remote sensing pioneers, Gentian transforms complex nature data into clear, actionable intelligence. We bridge the gap between technology and ecology, empowering organisations to see and value the habitats they impact.

A trusted partner
We don’t just provide data—we build lasting partnerships. Gentian’s solutions scale with your needs, delivering reliable insights that support compliance, resilience, and nature-positive action for businesses, governments, and consultancies worldwide.
 Biodiversity Assessment
BNG Assessment
Phase 1 Habitat Surveys
Ecological Surveys
Habitat Mapping
 Nature-related Reporting
TNFD Reporting
CSRD Compliance
Comply confidently with the Corporate Sustainability Reporting Directive (CSRD) using our solutions that offer accurate, transparent data for sustainability reporting.
Monitoring Reporting and Verification (MRV)
ESG Reporting
BNG Assessments
 Nature Restoration & Conservation
Peatland Mapping & Assessment
Obtain high-resolution insights into peatland extent and conditions, enabling targeted restoration and conservation efforts.
Tree Surveys
 Urban Biodiversity & Climate Resilience
BNG Assessments
Monitoring Reporting and Verification (MRV)
Tree Surveys
Learn more
Why Gentian?
Led by experts in ecology, remote sensing, and artificial intelligence, we make the invisible visible by illuminating the risks and opportunities associated with your organisation’s impact on the natural world. Leaders powered by Gentian are better equipped to manage nature-related risks, meet stakeholder expectations, and lead in sustainability innovation.
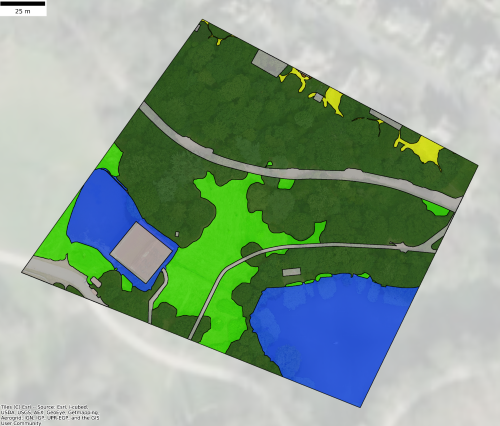

Gentian True Sight
Instant Biodiversity Net Gain (BNG) assessments
Rapid AI-powered habitat mapping software compatible with BNG metrics. Ideal for quick site screening and feasibility studies.
.png?width=952&height=671&name=unnamed%20(4).png)

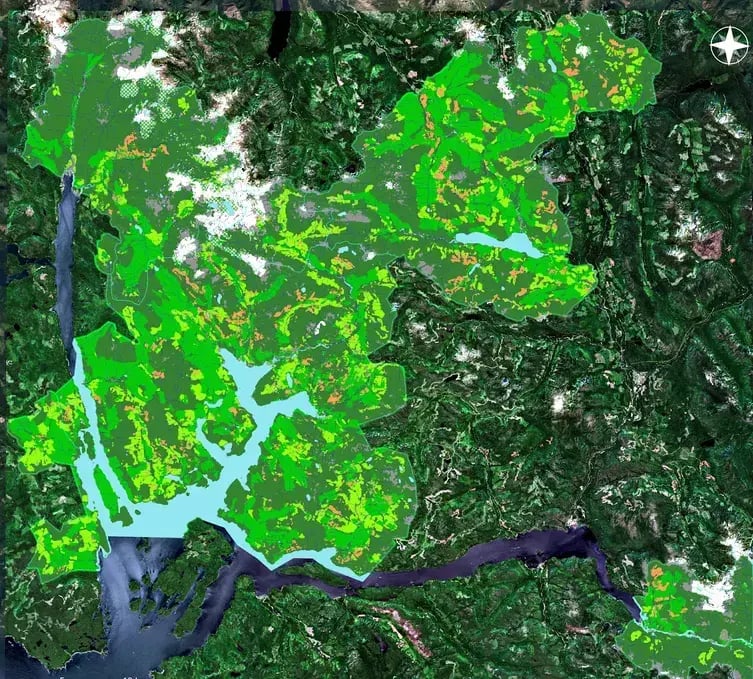
Gentian True Sage
Detailed habitat assessments and monitoring
Comprehensive biodiversity mapping software with high precision and accuracy, designed for nature-positive reporting, planning, and ongoing monitoring.

Gentian True Oracle
Bespoke enterprise biodiversity intelligence
Tailored AI-driven environmental insights and custom solutions for complex, large-scale ecological and sustainability challenges.
.png?width=2048&height=690&name=unnamed%20(2).png)

Gentian True Urban
Urban green infrastructure analysis
Detailed mapping of urban habitats, green roofs, and climate resilience to support sustainable city planning and development.

Globally scalable
Apply biodiversity MRV across sites around the world.

Fully remote
No fieldwork delays or seasonal constraints.
.png?width=96&height=96&name=icons8-pass-96%20(1).png)
Aligned with frameworks
Output formats compatible with TNFD, SBNTN, and CSRD.
.png?width=100&height=100&name=icons8-trust-100%20(1).png)
Trusted expertise
Data reviewed by ecologists and GIS analysts.

Using biodiversity insights to cut site scoping times
A leading UK facilities management company needed faster, scalable biodiversity assessments. Using Gentian True Sight, they cut site scoping time, reduced costs, and improved proposals, securing projects over competitors.
Scaling biodiversity monitoring to measure impact
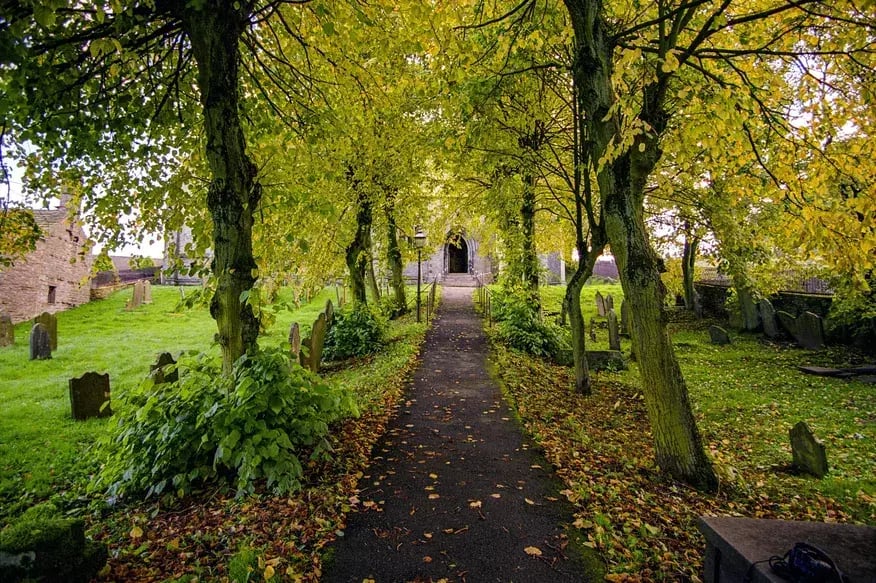
A large UK cemetery and crematoria operator used Gentian True Sage to map 50+ sites in 90 days, proving a 29 unit biodiversity uplift. The platform cut costs, streamlined reporting, and ensured scalable, evidence-based tracking.
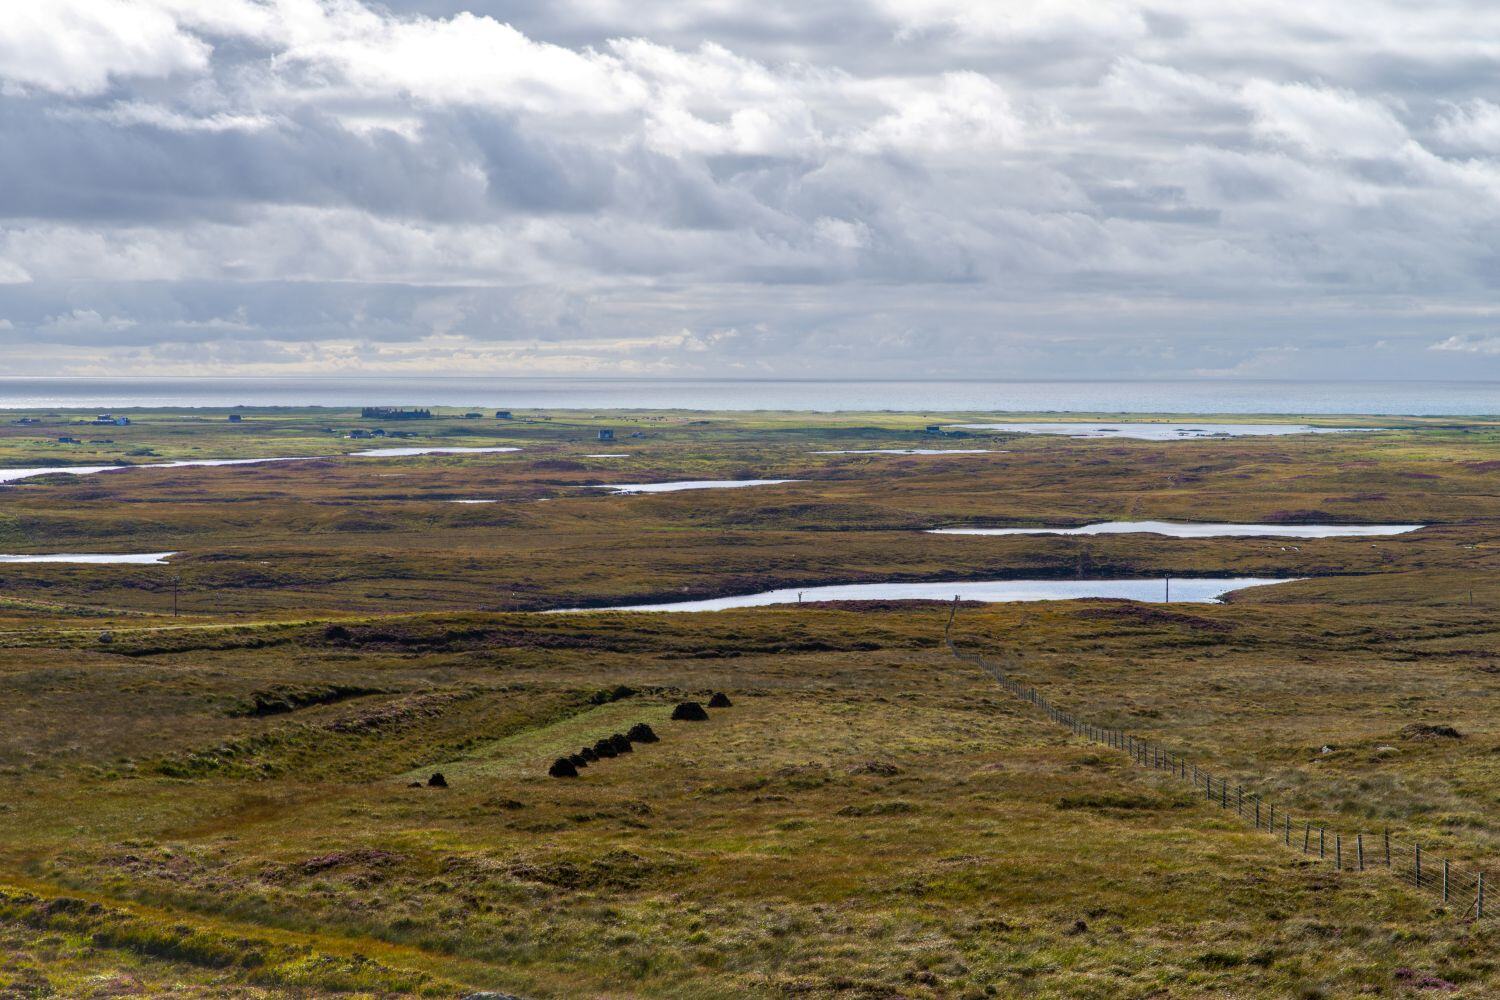
Using AI-driven insights to cut peatland monitoring costs
Scottish Power used Gentian True Oracle to monitor peatland restoration, cutting costs by 50%, achieving 100% site coverage, and ensuring compliance while avoiding costly penalties.
.png?width=1540&height=558&name=GFSA_DigitalBadge_withoutyear_2024%20(1).png)


Latest News & Articles

The latest on the landmark EU Deforestation Regulation (EUDR) and more
-1.png?width=400&height=250&name=Sans%20titre%20(7)-1.png)
Do I Need an Ecological Survey? The Top 5 Questions Every Business Should Ask
.jpg?width=400&height=250&name=dominik-vanyi-Mk2ls9UBO2E-unsplash%20(1).jpg)
Gentian Field Notes: Critical mineral finance, the Global Nature Summit in Manchester, the ESA New Space Workshop, and more
